
The Global Payments Report
Payment insights that drive growth
When it comes to global payments, there’s no standard consumer or one-size-fits-all solution. Each market’s payment landscape is unique, and so are its participants. How do you decide what’s relevant to your business?
The Global Payments Report helps you make sense of it all. Now in its eighth year, it gives you actionable insights and relevant facts across 40 markets to help grow your business.
Download now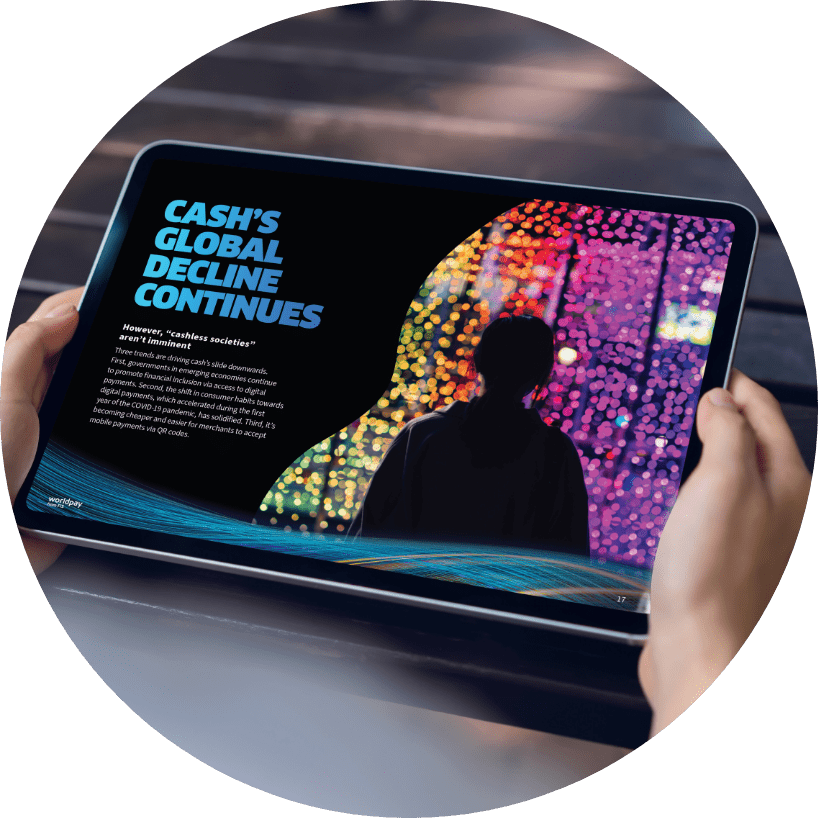
Keeping up withyour customers
From new real-time schemes to alternative payment methods, the world of payments is changing fast. How do you keep up with the latest trends where you do business? What do you need to know to successfully move into a new market? Explore our interactive map to see how consumers prefer to pay.
DISCOVER THE MOST POPULAR PAYMENT METHODS AROUND THE WORLD
Select your region
Select your market
Select your market
Select your market
Select your market
Select your market
How do you decide what's relevant to your business?
The Global Payments Report 2023 helps you make sense of payment complexity. We’ve been tracking consumer behavior at the checkout for the past eight years. So, with our expert insights at global, regional and market levels, you’ll come away with a better understanding of the technologies, methods and consumer preferences that are reshaping payments.
Explore our in-depth research into key global payment trends
A2A is disrupting payment value chains by winning over merchants with lower costs and immediate availability of funds
Credit card transaction values continue to increase, largely due to the resurgence of discretionary spending and global travel post-pandemic
Fintechs, banks, neobanks, super apps, Big Tech and device manufacturers are vigorously competing for this fast-growing payment segment
Digital payment methods continue to displace cash, yet the essential role of cash in most economies establishes a firm floor
The BNPL space is maturing across a more diverse range of providers, verticals, repayment plans and regulatory schemes
However, more merchants are discovering the benefits of accepting cryptocurrencies as payment for goods and services
The forecast remains bullish, despite more modest growth rates versus the early pandemic
Preview a market
Our in-depth guides give you an up-close look at 40 markets for a truly local perspective. Explore this sample to see a few of our valuable insights.
View now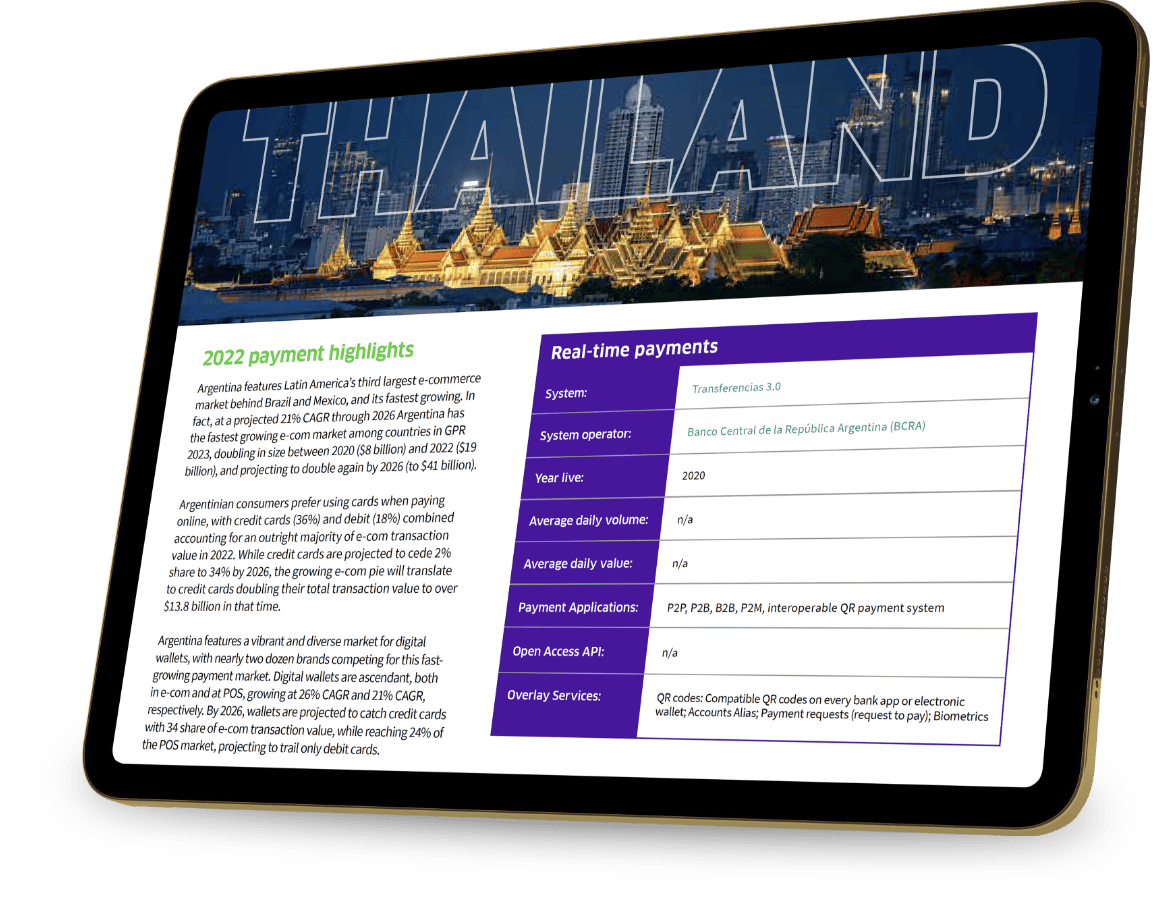
Thank you for requesting the 2023 Global Payments Report. Download your copy below.
Want more insights? Subscribe to our thought leadership or explore our solutions for payments.
Download reportDownload the report
We’ve got a world of payments insights prepared and waiting for you. It’s all just one step away. Enter your information below to get the full report today.
©2023 FIS®, Worldpay®, and any associated brand names/logos are the trademarks of FIS and/or its affiliates. All other brands, logos and trademarks are the property of their respective owners.
This content is for information purposes only. We have taken care in the preparation of this information but will not be responsible for any loss or damage including loss of profits, indirect, special or consequential loss arising as a result of any information in this document or reliance on it. The content of this material may not be reproduced without citing “Worldpay from FIS®, The Global Payments Report, 2023.”
This material may include information on third parties and their services. The reference to these third parties is for information purposes only and does not constitute an endorsement or recommendation of the third party or their service.
2022 e-com payment methods
Estimated share of transaction value*
*Totals may not equal 100% due to rounding.
2022 POS payment methods
Estimated share of transaction value*
Mobile as % of all e-com
Popular alternative payment methods
2021 card brand breakdowns (e-com and POS)
